CASE STUDY — RESEARCH TO LAUNCH · 2022 - 2023 · MULTI-TENANT ENTERPRISE SAAS
Displacing Oracle P6 with a modern critical path scheduling platform — trusted by Top 100 US contractors and backed by $26.5M in funding

Confidential — some details have been omitted to comply with my NDA.
50M+
Schedule Days Managed
30+
Top-100 US Contractors
$26.5M
Funding Raised
My Role
Senior Product Designer
Year
2022
Industry
Construction SaaS
Team & Collaboration
01
Senior Product Designer
End-to-end design ownership — user research, information architecture, wireframing, design system, high-fidelity UI, and usability testing.
02
Junior Designer (Design Expansion)
Visual design expansion — after I completed core design and flows, expanded all flows with required screens and designed multiple states (hover, disabled, error, loading).
Scope of Work
01
Zero-to-One Product Design
Owned the entire product from blank canvas to launch — information architecture, user flows, interaction patterns, and visual design for a scheduling tool built around a whiteboard canvas.
02
Research & Strategy
Ran discovery workshops with 6 stakeholders and 8 construction professionals. Pulled everything together into personas, pain points, and a clear set of design priorities.
03
Design & Prototyping
Ran 2–4 wireframe iterations per feature, tested with users at each stage, and shipped finished UI across 12 modules and 450+ screens.
04
Design System Foundation
Built the design system alongside product design — every component documented and ready to reuse as the product grew.
Overview
Goal
"Construction teams needed a scheduling tool built around how they actually think and work together — not around what legacy software could handle."
Background
Construction scheduling tools hadn't meaningfully evolved in decades. Teams relied on Primavera P6 and Microsoft Project — desktop-only software designed in the 1990s. When schedules changed, updates had to travel through email threads and file-sharing cycles that could take weeks. Nobody had a live view of what was happening. And if something changed on site, figuring out the downstream impact meant hours of manual recalculation.
The problem
Project managers spent weeks scheduling large projects. Updates were fragmented across email and spreadsheets. There was no single source of truth. When field conditions changed, teams couldn't quickly understand downstream impacts. Risk analysis was reactive — teams discovered problems after they happened. Most critically, these tools were so complex that only one person on the team could actually use them. Everyone else was locked out of the schedule.
My role
I was the lead designer on this — responsible for everything from the first discovery workshop to the final handoff. — ran stakeholder workshops, conducted user interviews, synthesized research into design decisions, iterated wireframes through usability testing, built the design system, and delivered high-fidelity UI across 12 modules. Worked directly with the co-founder, product owner, and engineering throughout. Later in the project, a junior designer came in and expanded the flows — additional screens, hover states, edge cases
The Challenge
Industry context
Construction is one of the world's most data-intensive industries — yet one of the least digitized. Single projects can have 1,000+ interrelated activities. Changes cascade in complex ways. Resource constraints interact with activity logic. Yet most teams are still managing this in tools that haven't meaningfully changed in decades, patched together with spreadsheets.
The core design challenge
Merge visual, drag-and-drop whiteboard interface (intuitive, fast) with full CPM calculation engine (rigorous, accurate). Every time a user drags an activity or draws a relationship, the engine must instantly recalculate critical path, float, duration, and downstream impacts.
Users wanted it to feel like Google Docs. The engine had to calculate like P6. That gap was the hardest design problem on the project.
Additionally, target users were experienced construction professionals, habituated to Gantt charts and tables. We were proposing a new interaction model: visual, spatial, whiteboard-based. Would they adopt it?
Core constraints
01 Design system discipline
Every component had to go into the design system at the same time as product design — slower at the start, but it meant we weren't cleaning up inconsistencies across 450+ screens later.
02 Limited research access
Remote-only research with limited construction professionals available. Every interview had to yield high-value insights.
03 Adoption risk
Construction teams deeply habituated to Gantt charts. We had to make whiteboard feel natural, not alien. That reality shaped almost every decision — if it wasn't immediately obvious, it wasn't going to get adopted.
Legacy tools vs. Planera — complex and disconnected vs. intuitive and real-time
Research
Discovery workshops & interviews
I facilitated two discovery workshops (6 stakeholders, 8 users) and conducted 8 remote user interviews with project managers, scheduling coordinators, superintendents, and engineers. We wanted to understand how they scheduled today, where things broke down, and what they actually needed from a tool like this.
Key findings
Every interview came back with the same frustrations.
"I spend 2-3 days every week managing spreadsheets. That's not value-added."
— Project Manager, Midsize GC
"When the field changes something, it takes me a day to figure out downstream impacts."
— Scheduling Coordinator, ENR 50
"We need to see relationships visually, not in a table. That's how I think."
— Superintendent, Heavy Civil
"Current tools force one person to be the expert. Everyone else is locked out."
— Senior PM, ENR 20
Four key insights
Insight 1: Visual relationships over numbers
Users thought spatially about schedules. They wanted to see how activities connected visually. That's what pushed us to make the canvas the main interface — not a supplementary view you switch into, but the place where all the work happens.
Insight 2: Collaboration is blocked by tools
Teams couldn't easily discuss and adjust schedules together. Email file-sharing created version control nightmares. Real-time collaboration wasn't a nice-to-have — it had to be built in from the start.
Insight 3: Risk was always discovered too late
By the time most teams discovered a scheduling problem, it had already happened. They needed a way to see risk coming — before it hit the timeline. This drove the decision to include risk simulation (Monte Carlo) as a core feature from day one.
Insight 4: Democratize expertise
Only specialists understood legacy tools. Teams wanted scheduling accessible to PMs, superintendents, and engineers — not just schedulers. That shaped how I approached everything — make it simple enough for a superintendent to pick up, powerful enough that a scheduler wouldn't outgrow it.
Wireframes
Wireframing & testing
Started with low-fidelity sketches, then moved into greyscale wireframes in Figma. Every major flow went through at least 2–4 rounds of testing before I was happy with it.
Round 1: Lo-fi sketches and basic wireframes
Testing basic layout, flow, and conceptual clarity. Identifying core interaction patterns without visual design.
Round 2: Greyscale wireframes in Figma
Incorporating feedback, refining information hierarchy, clarifying interaction states. Testing with product owner and key users.
Round 3: High-fidelity mockups
Visual design applied, all states designed (hover, disabled, error, loading), ready for developer handoff.
Round 4: Polish and refinement
Final pass before handoff — fixing anything that came out of testing, cleaning up inconsistencies, and sorting out what engineering flagged as difficult to build.
Design Decisions
Key design decisions
Decision 1: Canvas-based whiteboard interface
Why
Research showed users thought spatially about schedules. They wanted to see relationships visually. Planera's canvas lets users drag activities, draw relationships, and see CPM engine recalculate in real time.
What we built
Unlimited canvas. You drag an activity, draw a relationship, and the CPM engine recalculates instantly — critical path, float, downstream impacts, all of it. Multiple zoom levels, multi-user presence, all four dependency types supported.

Canvas-based interface — drag activities, draw relationships, CPM recalculates instantly.
Decision 2: Light theme with colour-coded activity cards
Why
Complex workflows require colour differentiation. When you're staring at a screen full of activities, dependencies, and dates all day, contrast matters. Low contrast on a dense interface is exhausting.
What we built
A light grey background with bright colour-coded activity cards by type, high-contrast text, distinct multi-cursor indicators, status icons, and clear hover states throughout.
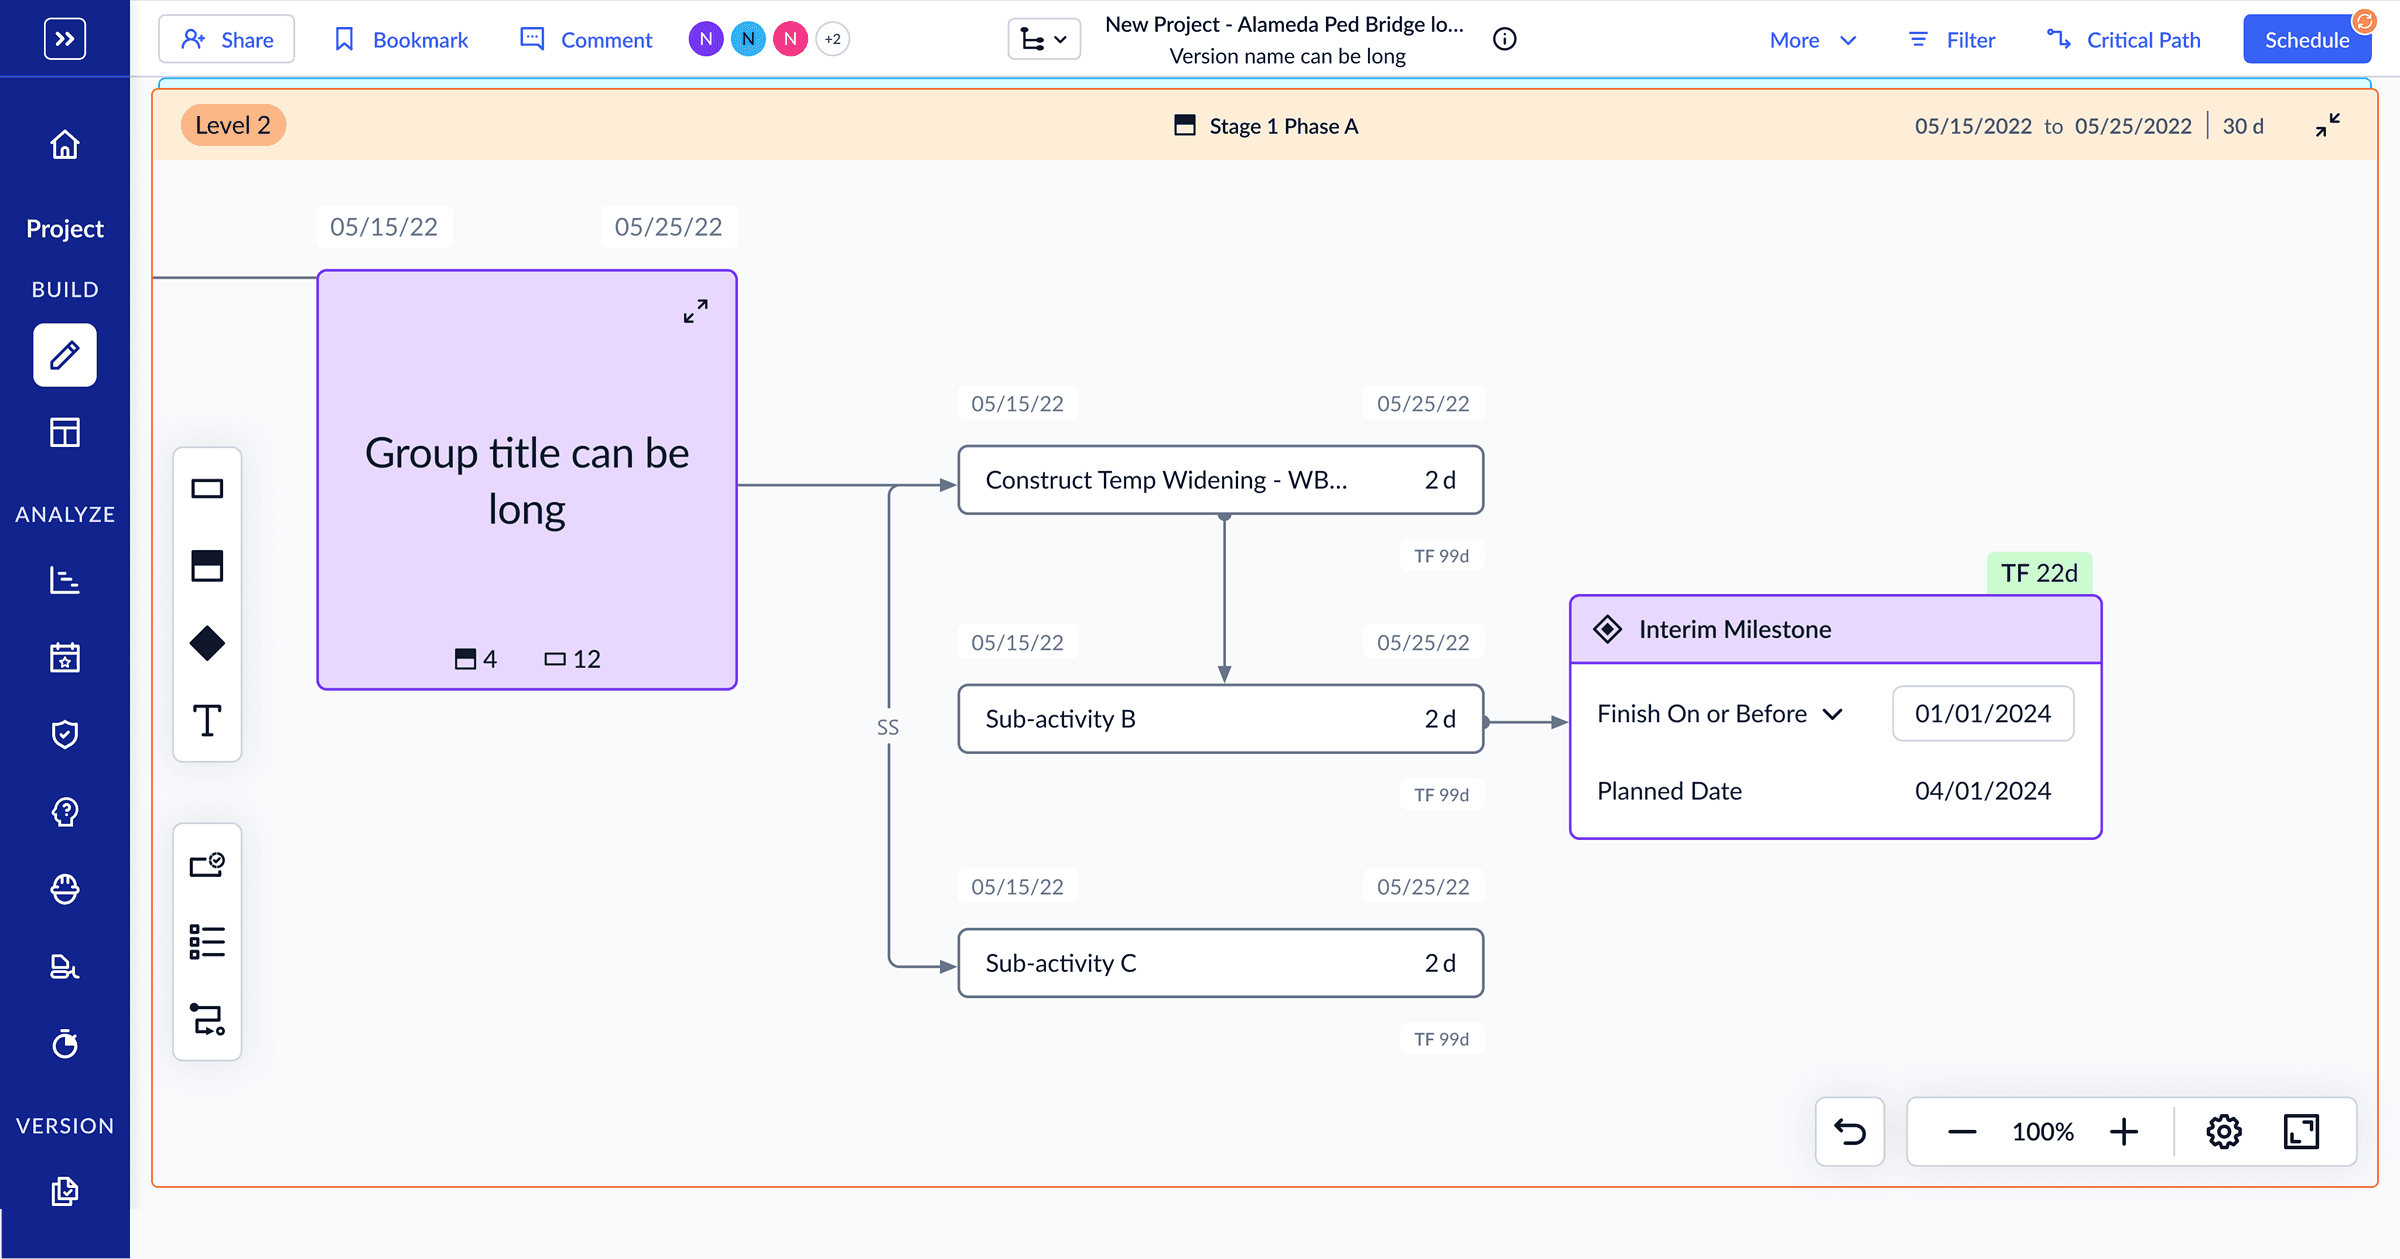
Light theme with colour-coded activity cards — high contrast for dense scheduling workflows.
Decision 3: Real-time collaboration layer
Why
Collaboration was the biggest workflow friction. Teams emailed files, creating version control chaos. Real-time collaboration wasn't a nice-to-have — without it, teams were back to emailing files around.
What we built
Real-time cursor visibility, instant change propagation without refresh, activity-level commenting, auto-save, presence indicators, and change notifications — so teams could work together on the same schedule without file sharing or version conflicts.

Real-time collaboration — multiple users, one live schedule, no version chaos.
Decision 4: Design system-first approach
Why
Shipping 450+ screens required consistency and scalability. Every component added to design system simultaneously with product design.
What we built
Colour system (10 shades per colour). Typography hierarchy. Spacing system (8px base). Component library (buttons, inputs, cards, tables, charts, custom scheduling components). Standardized interaction patterns.
Every component designed once and reused everywhere — so when something needed to change, we changed it in one place and it updated across the whole product.

Design system components — reusable, documented, and scalable across 450+ screens.
Outcome
What we shipped
Planera launched in May 2023 — a full CPM scheduling platform serving commercial, industrial, infrastructure, and data center construction teams.
Core scheduling
All four relationship types (FS, SS, FF, SF) with lag/lead support, activity constraints, critical path calculation, float analysis, and what-if scenario simulation.
Collaboration
Real-time multi-user collaboration with activity-level commenting — no file sharing, no version conflicts.
Integration
Import/export from P6 and Microsoft Project, with native integration with Procore and Autodesk.
Field execution
Field scheduling and lookahead planning, resource loading and tracking, progress monitoring, and variance analysis.
Compliance
DCMA 14-point compliance checks, customisable reporting, and data export.
Business impact
Adoption
50M+ schedule days planned across projects ranging from mid-market to $400M+ in contract value.
Market validation
Teams switching from P6 report that scheduling is faster, email chaos is gone, and people beyond the lead scheduler can actually use the tool.
Funding
$5.4M seed in May 2023, followed by a $13.5M Series A in August 2024 — $26.5M total, led by Sorenson Ventures, Firebolt Ventures, and construction executives.
Competitive wins
Planera displaced P6 at major contractors. Early adopters report:
"Replaced P6 without losing analytical power. Now our entire team uses it."
— Senior PM, ENR 100 Contractor
"Scheduling reduced from weeks to hours. Better decisions, faster."
— Chief Scheduler, Heavy Civil Firm
"Real-time collaboration transformed how office and field work together."
— Project Executive, ENR 50 Firm
Key product capabilities
Beyond the canvas, Planera covers the full scheduling workflow — risk simulation for proactive scenario planning, and Gantt view for teams more comfortable with traditional scheduling tools.

Gantt view with compare — alternative visualisation for users familiar with traditional scheduling tools, enabling side-by-side scenario comparison.

Risk simulation — Monte Carlo analysis lets users test scenarios and forecast delays before they hit the project timeline.
Reflection
Learning 1: Whiteboard products require different design thinking
Whiteboard tools require spatial, holistic thinking. Every pixel is an interaction point. Single design decisions cascade across dozens of patterns. You can't solve components in isolation — everything affects everything else.
Learning 2: Domain Expertise is Essential
Understanding CPM logic, float calculations, compliance requirements, and construction workflows directly informed design. You can't design for construction schedulers the same way you'd design a consumer app. The domain knowledge matters as much as the design skill.
Learning 3: Design system discipline pays dividends
Building design system in parallel with product design forced rigor and consistency. That discipline is the only reason shipping 450+ screens was manageable.
Learning 4: Adoption risk with new paradigms is real
These were experienced professionals who'd used the same tools for 20 years. We had to make the whiteboard feel familiar before asking them to trust it — high contrast, clear patterns, nothing that felt alien.
Learning 5: Constraint-driven design produces better solutions
Not being allowed to design custom one-off elements forced better thinking. Every component had to work across multiple contexts — and the designs ended up cleaner and more consistent because of it.
Explore how I designed performance monitoring and compliance reporting app for Mediterranean Shipping Company (MSC) — 650+ vessels, compliance reporting cut from 7 days to 2
Read next case study