CASE STUDY — RESEARCH TO LAUNCH · 2023 - 2024 · MULTI-TENANT ENTERPRISE SAAS
Designing performance monitoring and compliance reporting app — 650+ vessels, compliance reporting cut from 7 days to 2
A comprehensive documentation from research to launch. Read in full or in parts, depending on your time.

Confidential — Some information in this case study has been omitted or modified to comply with my NDA.
650+
Vessels Onboarded
7 → 2 Days
Compliance Reporting
450+
Active Users
My Role
Senior Product Designer
Year
2023 – 2024
Industry
Maritime SaaS
Timeline
6 Months
Team & Collaboration
01
Senior Product Designer (Me)
End-to-end design ownership. Research · UX · UI
02
Product Manager: Sigrid (Norway)
Feature prioritisation · Sprint planning · Stakeholder alignment
03
VP of Maritime: Anders (Norway)
Strategic direction · Feature design reviews every sprint
04
Solution Architect: Bappaditya (Bangalore)
Technical feasibility · Data architecture decisions
05
Technical Lead: Prabhu (Bangalore)
Component behaviour · API constraints · Handoff
Introduction
About me
I am Devendar, a Senior Product Designer at Kongsberg Digital (now rebranded as Falkor), Bangalore. I joined Kongsberg Digital in April 2021.
Why this case study?
This is a case study of a launched product, I have started designing in year 2023. A comprehensive documentation that covers majority of my design decisions and work. The field research was conducted across 3 countries, with 13 user interviews and 13 contextual inquiry sessions with fleet performance managers, and a product that today runs with 650+ vessels worldwide.
Outcome and Impact / TL;DR
An enterprise SaaS application built for merchant fleet operators, giving them real-time and historic vessel performance data, automated compliance reporting, and passive alert monitoring across large fleets, replacing manual, time-intensive reporting workflows with a purpose-built application.
I led design for Vessel Performance Merchant from research to launch, 2023 to 2024, a new SaaS application built for MSC's fleet of 500+ merchant vessels. I ran 13 user interviews and 13 contextual inquiry sessions across Geneva, Oslo, and Gothenburg, and I turned three findings from that research into the product's core features.
I designed and shipped the MVP in 6 months, from kickoff in July 2023 to pilot launch in January 2024, and the product reached full scale by April 2024. Today it runs on 650+ vessels with 450+ active users, and it cut monthly compliance reporting from 7 days down to under 2 days.
Background
Kongsberg Digital and MSC partnership
In 2022, MSC (Mediterranean Shipping Company), the world's largest container shipping line, signed a five-year contract with Kongsberg Digital to digitalize their entire fleet of 500+ vessels. Maritime Executive
The agreement had four goals
Collect and contextualise vessel data on cloud from the shore office.
Use performance applications to reduce fuel consumption and optimize voyage.
Enable correct and efficient vessel data reporting to regulatory authorities.
Increase crew safety and welfare through stable connectivity.
Kongsberg Digital's platform
Vessel Insight, a cloud data infrastructure service that collects and contextualizes data sent from a ship to the cloud, formed the foundation.
Vessel Performance, built initially for offshore vessel operations, ran on top of Vessel Insight to give operators analytics and insights for fuel consumption and voyage optimization.
Why a dedicated product
Vessel Performance had been proven on offshore vessels, oil and gas operations with dynamic positioning and shorter, variable voyages. Merchant vessels operate differently: long, stable, scheduled voyages, planned weeks in advance.
After more than a year running on MSC's merchant fleet, deployment data made that operational mismatch clear. Fuel consumption gains were not tracking to plan, and the reporting workflows built for offshore use didn't map cleanly onto merchant compliance needs.
Key Driver 1: The operational problem
Offshore and merchant segments have distinct operational profiles and optimization requirements. Offshore vessels operate on shorter, dynamic voyages, and often hold a fixed position at sea for extended periods, dynamic positioning. Merchant vessels run long, stable, scheduled voyages weeks in advance, either on repeated routes or the spot market depending on contract.
The data from MSC's deployment confirmed what the operational profiles suggested: the difference between the two segments was significant enough that one application couldn't serve both well. That finding, not a product failure, is what justified building Vessel Performance Merchant as a dedicated application.
Key Driver 2: The regulatory pressure
At the same time, the International Maritime Organization enforced its IMO 2023 rules, requiring vessels to calculate an Energy Efficiency Existing Ship Index (EEXI) and establish an annual Carbon Intensity Indicator (CII) rating.
EEXI and CII added new compliance requirements on top of existing MRV and DCS reporting. Non-compliance carried heavy penalties.
Kongsberg Digital saw the strategic opportunity this created. Combined with MSC's direct request for a purpose-built merchant performance solution, it accelerated the decision to build Vessel Performance Merchant from scratch.
The Case for Research
Kick-off
In July 2023, the Product Manager for Performance Applications presented merchant shipping customer feedback and a 19-point wish-list for the new Vessel Performance Merchant.
I was appointed to lead this new product design initiative. Being appointed to lead gave me the mandate to propose research. It did not automatically give me the budget or the timeline for it. That had to be earned with evidence. My first task was to study the customer feedback. I spent time on desk research to understand why Kongsberg Digital needed a new product at all, rather than extending the existing Vessel Performance application.
The goal when we started
A Vessel Performance Merchant application to enable fleet performance managers view vessel’s high frequency sensor data, vessel’s historic data analytics and enables download compliance reports.
A gap I needed to close
The wish-list had 19 performance indicators for merchant vessels. It came from MSC's management, compiled into a shared Excel sheet.
The list captured what MSC's management wanted to see. It had not come directly from the people who would use the product every day, the fleet performance managers. I read it as shaped more by business ambitions than by confirmed user needs, and I treated that gap, between what management wanted and what operators actually needed, as something to verify before designing against it, not as a flaw in their judgment.
The overall business goals were clear. How both companies would achieve them was not.
I knew what skipping user research at this stage would cost:
Misreading user needs as business needs.
Product decisions built on assumptions.
Ambiguity that would follow the team all the way to launch.
If the product failed to meet customer expectations, that cost would far exceed the cost of doing the research right.
This was the moment I decided to build the case for research, rather than assume my recommendation as lead would be enough on its own.
Building the case for research
My first step was to present a design strategy to the VP of Maritime and the Product Manager. I made the case for user research before any design work began.
Product leadership proposed an alternative: interview customer success managers instead, and gather requirements through them.
I did not think that was enough. Customer success managers know what customers complain about. They do not know what fleet performance managers actually do at their desk every day. The two are related, but they are not the same evidence.
Leadership's proposal stood, but I had a second path. Individual interviews would take time to arrange and approve, so I ran a discovery workshop instead, to move faster and collect a first set of real data.
Discovery Workshop 1
I facilitated a structured discovery workshop with nine participants: customer success managers, growth managers, and a product manager from three shipping companies. The session ran 180 minutes on a remote whiteboard.
I asked every participant two questions. What frustrations and pain points are you hearing from customers in your weekly meetings? What are the important performance requirements for merchant vessels that the existing application is not meeting?
After the session, I extracted the transcript, clustered the information, and prepared a report. The findings were full of performance indicator requests and feature wishlists, with very little about what fleet performance managers actually needed to do their job.
The output confirmed the gap I'd flagged earlier. A workshop built from customer success managers and growth managers had produced KPI-focused features, not user needs, which was exactly the limitation of secondhand evidence, however well-intentioned the participants were.
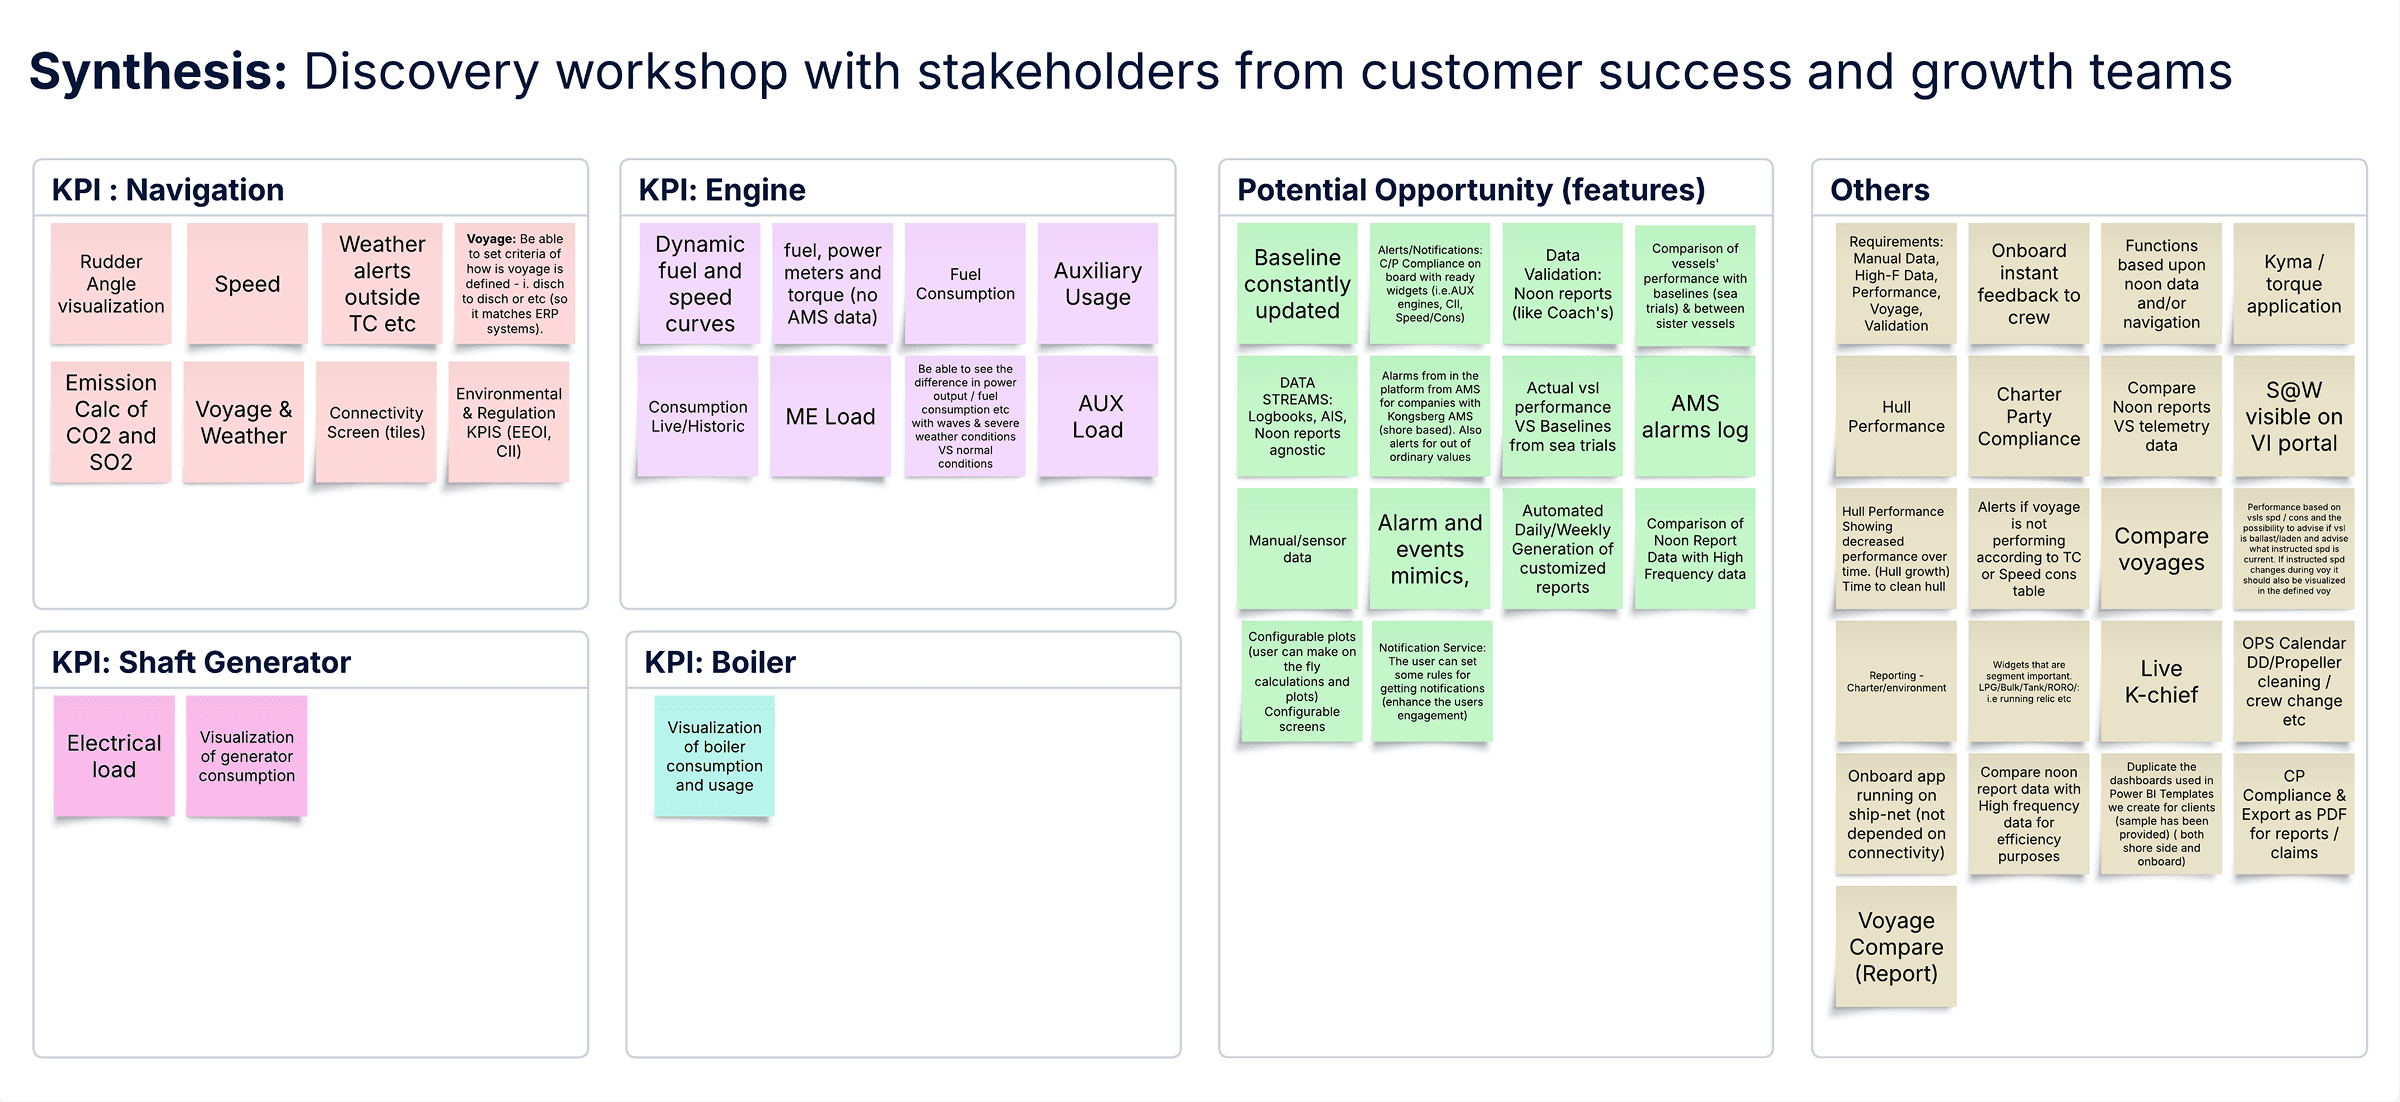
Synthesis from discovery workshop 1 — KPIs and potential feature drivers.
The second pitch
I went back to product leadership, this time with workshop data behind the argument rather than just a recommendation.
I presented one theme from the findings: ambiguity. Multiple priorities, no clear direction, and by my read of the workshop output, more than 60% of the product decisions at this stage rested on assumptions rather than confirmed rationale.
I made one argument to the VP of Maritime and the Product Manager:
The cost of failing to meet customer expectations would be far higher than the cost of investing in field research with real users.
It worked. I was approved to conduct field research in Geneva, Switzerland; Oslo, Norway; and Gothenburg, Sweden.
Preparing for Field Research
Research strategy
I applied for a visa and started preparing a research strategy while the Product Manager recruited fleet performance managers from three shipping companies across three countries.
No. of interviews
13
Method
1:1 Semi-structured
Interview length
60 minutes
User profiles
Fleet Performance Manager, Fleet Energy Efficiency Coordinator, Fleet Energy Efficiency Manager, Fleet Performance Expert
Unser interview session outline
05 min - Intro, Purpose, How KDI will store and handle data
50 min - Interview to discover based on objectives
05 min - Wrap up & share what's next?
User interview objectives
Discover "What are your day to day activities at work?"
Discover "How digitalization can help you to be more efficient at work?"
Discover "What is important to see in a cloud app in terms of performance KPIs of a vessel?"
Discover "Answers to follow-up questions and anything which is not covered."
Contextual inquiry
Conduct contextual inquiry with each user in a normal work setting; fleet performance manager using Vessel Performance Offshore while sitting in their office. Ask each user to perform set of tasks and record observation.
Discovery workshop 2
Before flying to Geneva, I requested one more session. I conducted a workshop with MSC's management stakeholders; the same people who had originally shared the wishlist and feedback.
The goal was to understand their expectations, business goals, and decision drivers directly. The workshop helped me prepare specific questions and sharpen the research direction before meeting real users for the first time.
Situation → Decision → Opportunity = Early concept wireframe
During the workshop, MSC management made a direct ask. They wanted to see something tangible before the field visit to Geneva.
I saw an opportunity. I created concept wireframes to test with fleet performance managers during the field research. Three concepts:
A screen to show a vessel's real-time sensor data.
A screen to view historic data analytics for fuel consumption.
A screen to present the data in a reportable format.
This meant I could test these early concepts and record first reactions from real users alongside the interviews.
Research Geneva, Switzerland
Geneva, Switzerland — 4 September to 5 September
On 3 September I travelled to Norway. On 4 September I took an early morning flight to Geneva along with the Product Manager, the Director of Customer Success, and a Customer Success Manager.

Photo: MSC Headquarters · Geneva, Switzerland · September 2023
Day 1: Setting the stage
Before the sessions began, the Director of Customer Success presented to the MSC team to set the stage, define expectations, and explain the goal of the research visit.
Day 1: Contextual inquiry
I facilitated two contextual inquiry sessions. I asked each fleet performance manager to perform three tasks on the existing Vessel Performance application.
Navigate and find the vessel's fuel consumption from the last five days.
Navigate and find the vessel's location history from the last five days.
Extract fuel consumption and power consumption data into a file and check it for correctness.
I observed how they worked. Where they struggled to find information. How they navigated. And where the terminology in the application did not match the language merchant fleet performance managers actually use.
Day 1: User interviews
After the contextual inquiry sessions I conducted two user interviews. I prepared diary notes for each session. Midway through the day we agreed that both the Product Manager and I would ask questions during interviews, and record voice with the participant's consent.
Day 1: Dinner and conversation beyond formal interviews
In the evening of Day 1 we had dinner with fleet performance managers and MSC management. The conversation moved beyond the formal interview setting. We talked about day to day life, what a good day at work looks like, what a bad day at work looks like. That dinner gave us knowledge about users that no interview script would have uncovered.
Day 2: User interview and wireframe presentation
Day 2 was three more interviews. One participant pair requested to be interviewed together as they shared similar technical knowledge. It had minimal impact on the quality of data so I agreed.
Post lunch on Day 2, I facilitated a concept wireframe session. I presented the early concepts to fleet performance managers one by one and recorded their first reactions. The impression was positive. The concepts were aligning with the needs I had already observed in the contextual inquiry sessions.
Connect CMS Image fields (Image 1–10)
Diary notes from user interviews with 5 participants.
Research Oslo, Gothenburg
Oslo, Norway and Gothenburg, Sweden — 7-8 September
On 7 September I conducted four user interviews and four contextual inquiry sessions with fleet performance managers at a shipping company in Oslo, Norway.
On 8 September I conducted four more interviews and four contextual inquiry sessions with fleet performance managers at a shipping company in Gothenburg, Sweden.
By the end of 8 September I had completed 13 user interviews and 13 contextual inquiry sessions across three cities with fleet performance managers from three shipping companies.
Research Synthesis
Synthesis workshop, Oslo, Norway
On 9 September I went to Kongsberg Digital's Oslo office. I facilitated a full day synthesis workshop with the Product Manager and stakeholders.
The goal was to review everything collected across 13 interviews and 13 contextual inquiry sessions. Identify anything crucial that may have been missed. And agree on the next steps before flying back to India.
That was a wrap of the field research. I flew back to Bangalore the same evening.
Synthesis, Bangalore, India
I spent two full days on synthesis. This was an intensive exercise. I worked through multiple rounds — extracting patterns from 13 interview transcripts, clustering diary notes, separating user pain points from domain knowledge, and mapping what fleet performance managers said against what they actually did during contextual inquiry sessions.
I prepared synthesis boards for each participant, mapping to research objectives.

Interview synthesis board from diary notes. Same prepared for each participant.
Synthesis of user interview data
I then built a consolidated view across all Geneva participants — clustering findings into five categories. Role and responsibilities. Goals and motivation. Potential features and expectations. Pain points. Domain knowledge.
Each round of synthesis was reviewed with the Product Manager to refine the findings and pressure test the conclusions. Nothing was taken forward as a product decision without being traceable back to something a fleet performance manager said or did during the field research.
Consolidated view
Click on image to zoom.
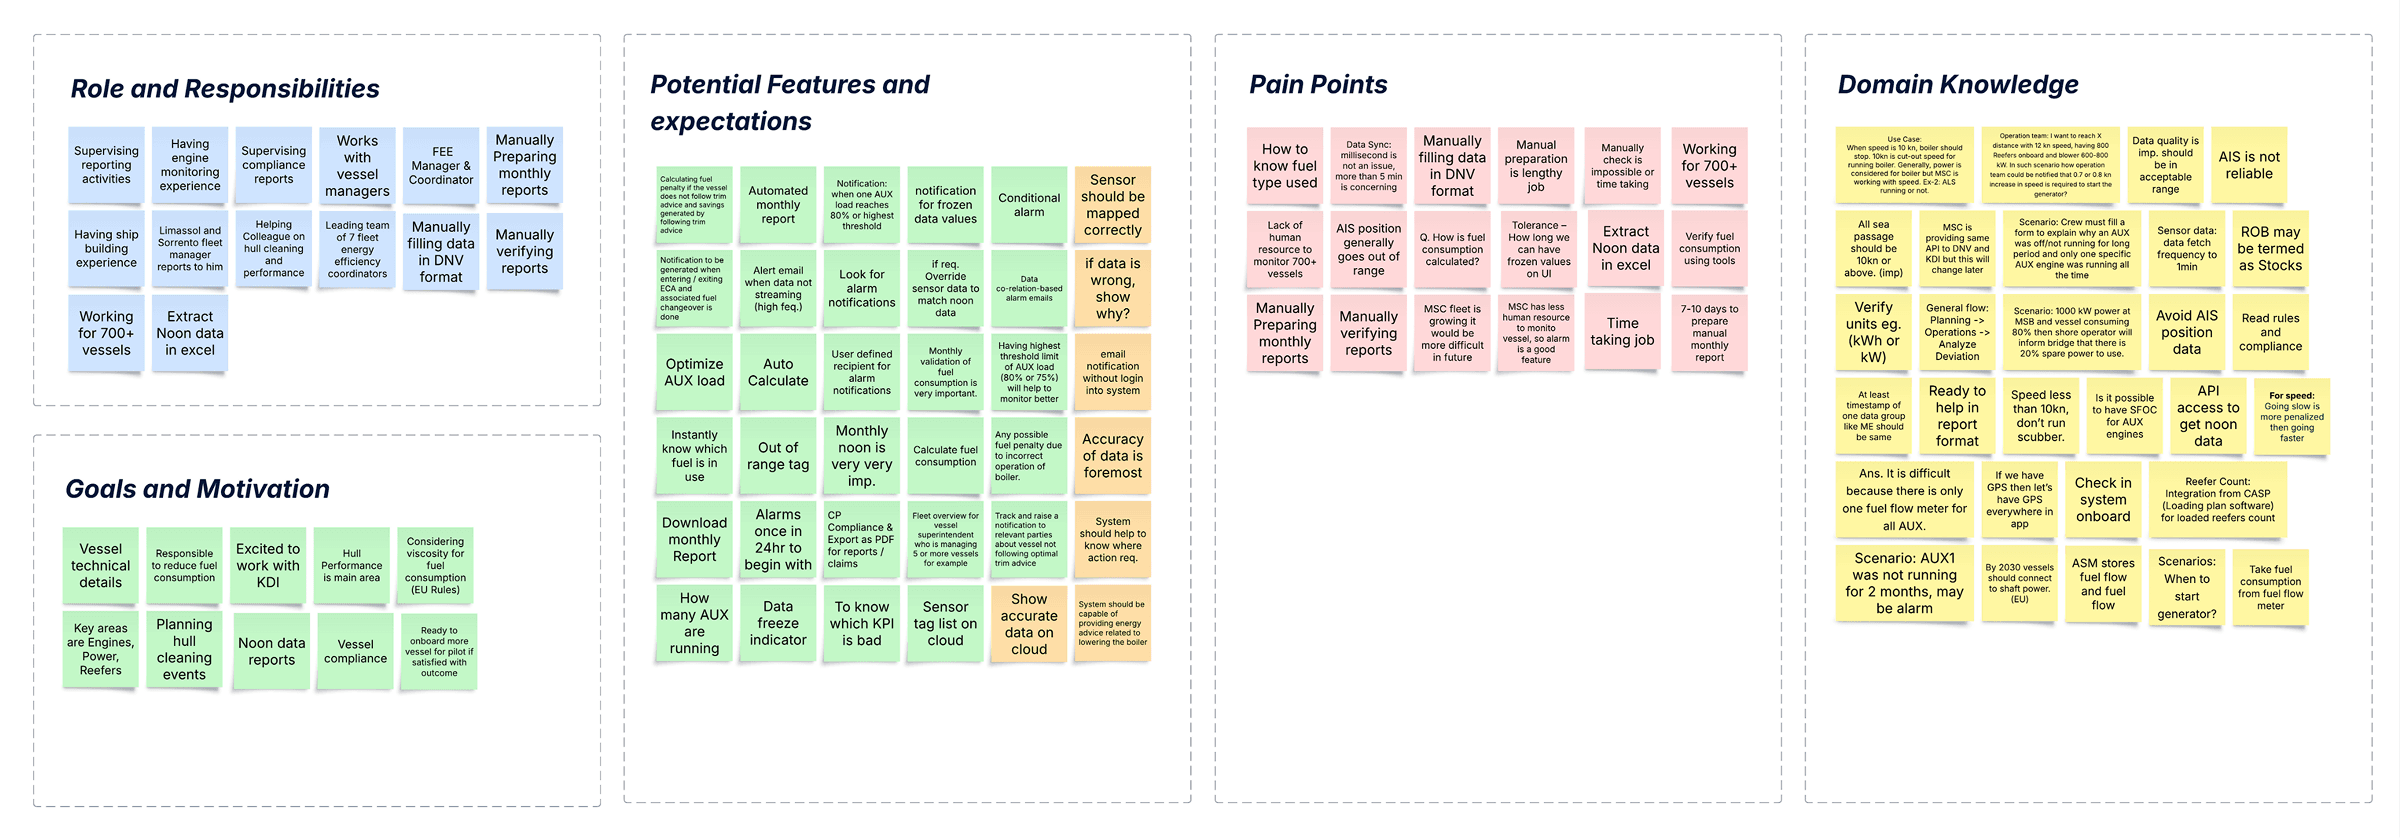
Synthesis of user interviews data: themes across roles, goals, potential features, pain points, and domain knowledge.

Synthesis of user interviews data: themes across vessel performance KPIs.
Research Insights
Three findings that changed the product
Three findings came out of the research that were not in the original plan. None of them were in MSC's wishlist. All three became core features of Vessel Performance Merchant.
Fleet performance manager typically responsible for 5 to 10 vessels, was spending 7 to 10 days each month preparing compliance reports across that fleet.
MSC's fleet had 500+ vessels. That meant thousands of person-days every month on manual reporting. Fleet performance managers were manually filling data into DNV format spreadsheets, verifying figures, and sending reports to regulatory authorities.
The fleet size was growing. These challenges were likely to become more difficult to manage. This finding directly led to the automated monthly report generation feature.
Opportunity — Automated Monthly Report Generation
Fleet performance managers had no way to passively monitor 500+ vessels without sitting at a screen continuously.
There was no alert system. If a vessel's fuel consumption crossed a threshold, no one was notified. Fleet performance managers had to actively look at the data to catch anomalies. With a fleet of 500+ vessels this was not sustainable. This finding directly led to the Alarm Management feature.
Opportunity — Alarm Management
Fleet performance managers on shore had no way to collaborate directly with crew onboard the vessel.
Decisions made on shore could not be communicated back to the vessel in context. There was no shared view between shore office and the ship. This finding directly led to a new vessel onboard application for collaboration with onboard crew.
Opportunity — New Vessel Onboard Application
Persona
After synthesis I built a persona from the research data. The Fleet Energy Efficiency Coordinator — the primary user of Vessel Performance Merchant. Responsible for monitoring fuel consumption, power, and emissions across a group of vessels. Preparing monthly compliance reports manually for each vessel. Working under regulatory pressure with limited tools.
This persona guided every design decision that followed.

Feature mapping to user needs and business goals
I mapped each research finding to a user need, each user need to a product feature, and each feature to a business objective. Nothing on the feature list was added without a direct line back to something a fleet performance manager told me during the field research.
Feature — Vessel Sensor Data Current View
User Need
Fleet performance managers needs access to the vessel's high frequency sensor data on cloud, real time.
Business Objective
Continuous monitoring of vessel’s current state and performance for decision making during voyage.
Feature — Vessel Sensor Data Historic View
User Need
Fleet performance managers needs access to vessel data analytics for performance KPI trends over time and valuable insights.
Business Objective
Optimize vessel’s future voyage decision making to maximise profit and onboard crew safety.
Feature — Auto Email Monthly Vessel Performance Report
User Need
Fleet performance managers needs anomaly free vessel data for reporting to regulatory authorities.
Business Objective
Enable correct and efficient vessel compliance reporting to regulatory authorities to avoid heavy penalties.
Feature — Alarm Management
User Need
Fleet performance managers needs passive monitoring of vessel performance rather than actively looking at the screen.
Business Objective
Utilise fleet performance managers time efficiently to improve vessel performance and maximise profit.
New App — Vessel Onboard Application
User Need
Fleet performance managers needs to collaborate with vessel onboard crew for implementing voyage decision making.
Business Objective
Increase crew safety and welfare through stable connectivity and collaboration with shore fleet performance manager.
From research to product decisions
On 13 September I facilitated the first of three workshops with the engineering team in Bangalore. Nine engineers, one solution architect, and the Product Manager. The goal was to present the research findings and answer three questions:
What are we going to build?
How are we going to build it?
For whom are we going to build it?
The outcome of three workshops was a scoped MVP. Five core features. A pilot launch target of January 2024.
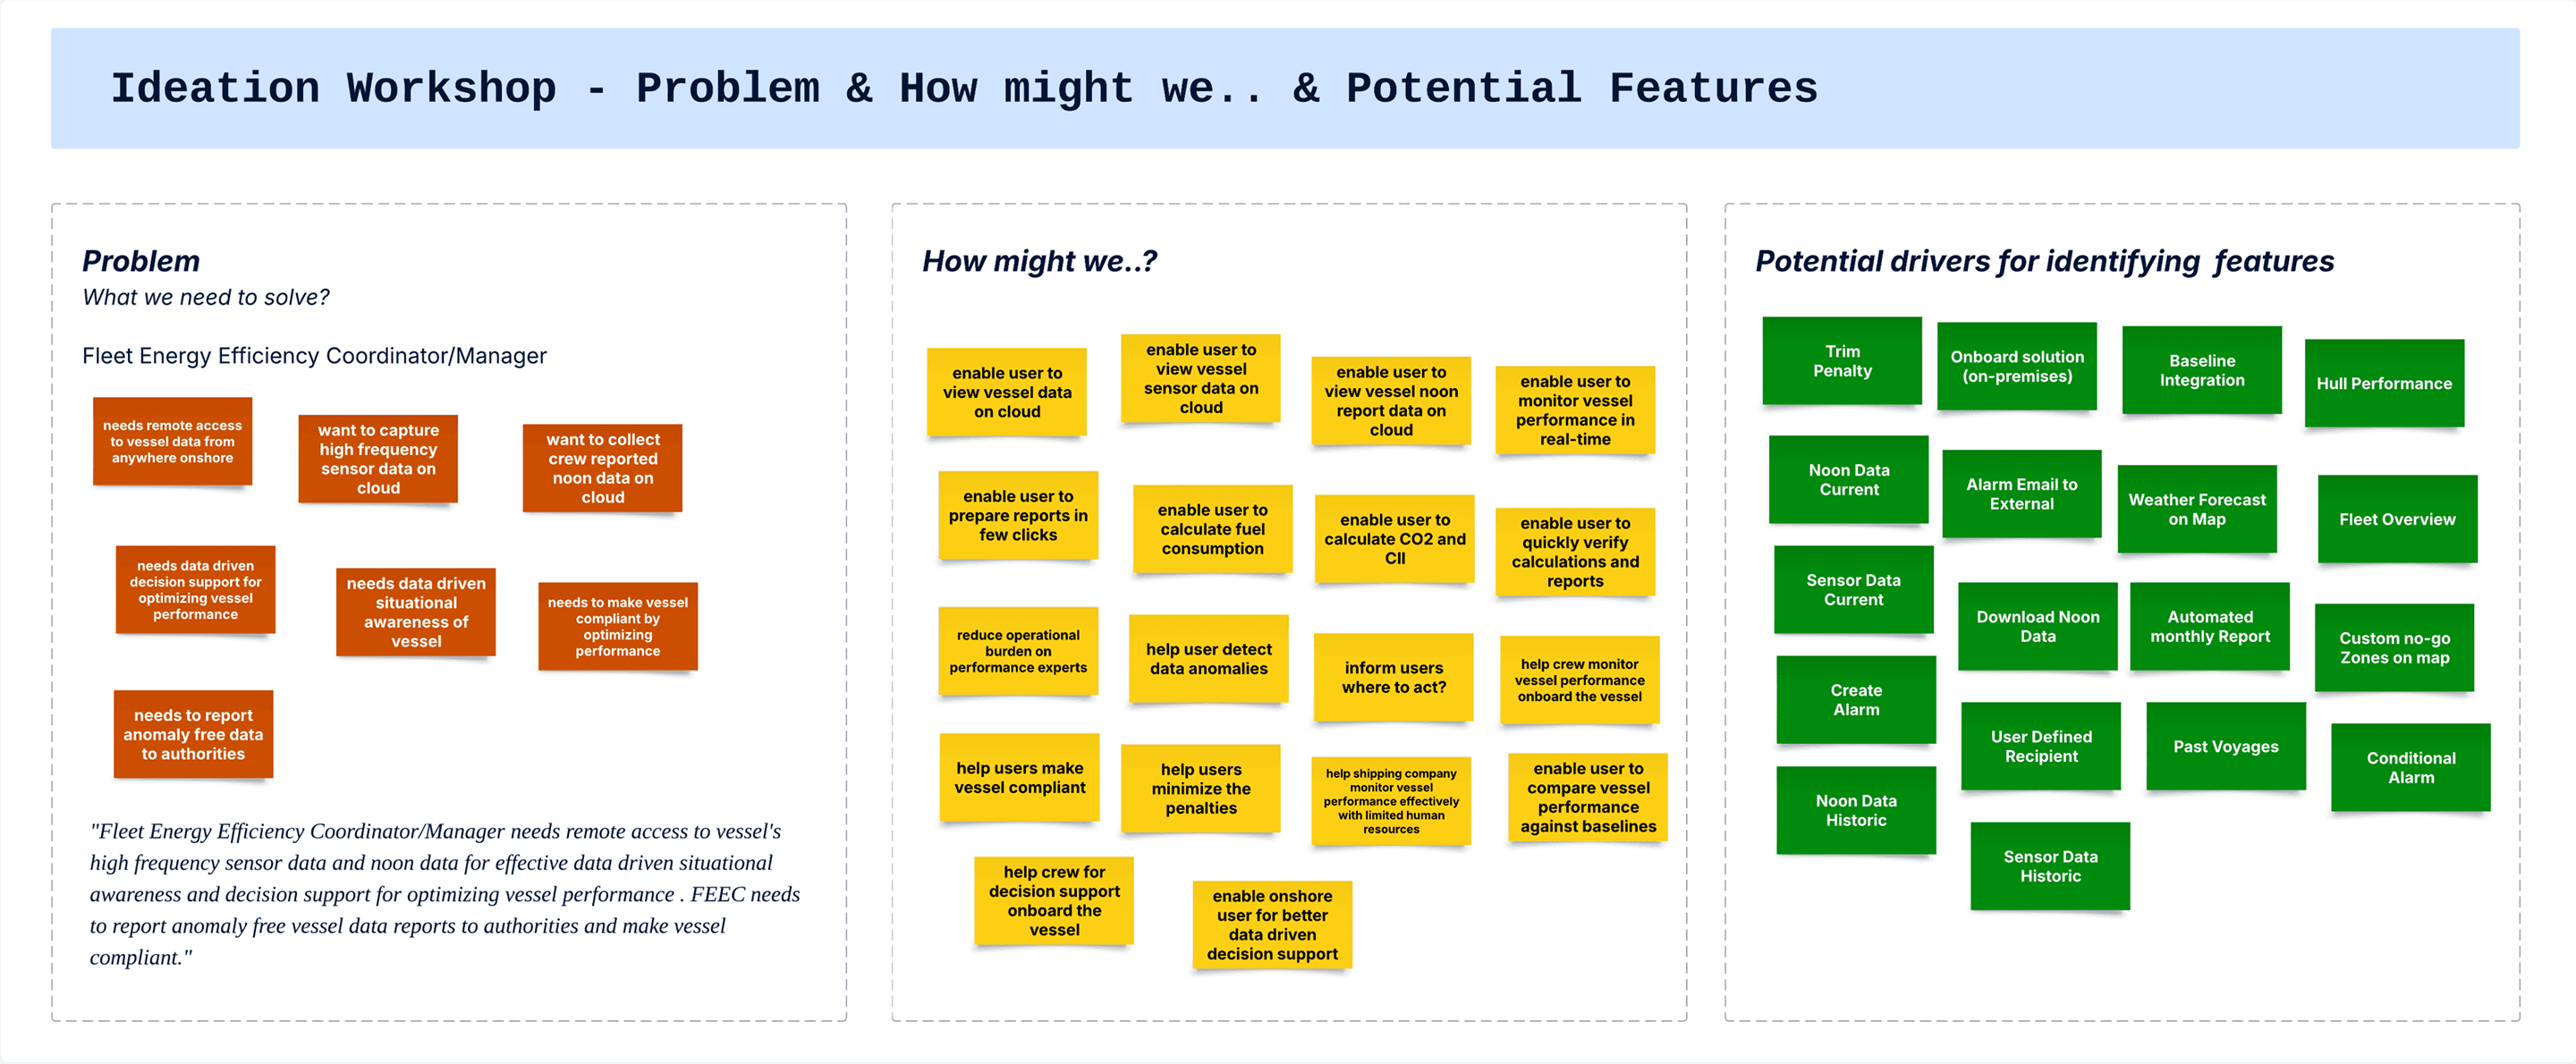
Ideation workshop — problem statement, how might we, and potential features identified.

Ideation workshop — Must have MVP features, can wait and future release features.

Ideation workshop — Task flows of Vessel Performance Merchant MVP features
Conflict and Resolution
The Alarm feature conflict
The engineering team pushed back on including the Alarm Management feature in the MVP. The solution architect and engineering lead felt it was too complex to build in three months and requested it be moved to a later release.
The Product Manager refused. The Alarm Management feature was central to the upselling strategy and crucial to test during the pilot.
I was caught between two sides.
Alarm feature was a primary feature for the upselling strategy — a direct path to selling a second product, the vessel onboard application, to shipping companies who needed their shore teams and onboard crew to act on the same alerts.
The partial win
I suggested a middle path. Park the alarm view feature in the vessel onboard application for Phase 2. Keep the Alarm Management feature in the cloud application for the MVP but detail it fully with all functionality.
Rationale: Alarm management feature require intensive usability testing, and later training users for how to create alarm for each KPIs, how to follow logic and rules while creating alarm, how cloud to onboard collaboration work using 2 different applications. Onboard application can follow after this.
The Product Manager agreed on that condition.
The solution architect and engineering lead were still not convinced.
My suggestion to test feasibility through wireframes.
I suggested a middle path. Build and test a low-fidelity clickable wireframe prototype of the Alarm Management feature first. Let the prototype answer the engineering team's doubts before making the decision.
Everyone agreed to test alarm feature feasibility through wireframes and then decide the scope.
The alarm logic design
I spent a day designing the prototype. The Alarm Management feature allowed fleet performance managers to create custom alerts for any performance indicator. A fleet performance manager selects a KPI data point, a comparison operator, and a threshold value.
Multiple conditions can be combined using AND or OR logical operators. If a vessel's fuel consumption crossed a set limit, the system would notify the operator automatically.
The resolution
I facilitated a brainstorming workshop with eight participants. One Product Manager, one solution architect, one engineering lead, two full stack engineers, one backend engineer, and one QA engineer.
The prototype answered their questions, cleared the ambiguity, and resolved the disagreement.
The whole team aligned. The Alarm Management feature was included in the MVP.
High-fidelity UI — Create New Alarm feature

Vessel Performance Merchant - Create New Alarm feature overlay modal.
Wireframing & Prototype
Wireframe Testing
I began with low-fidelity paper sketches, discussing concepts iteratively with the Product Owner before moving to greyscale wireframes in Figma.
I built a clickable early wireframe prototype and ran three rounds of testing, going back and forth between sketches and Figma until the concepts actually well aligned with real users needs.
Every round changed something; navigation, data density, how we labelled engine states, where the map lived. Nothing stayed where it started.
Designing VPM Main Dashboard - Vessel Sensor Data Current
I designed one feature at a time, starting with the Vessel Sensor Data Current View. I tested wireframes directly with fleet performance managers — the same people I had interviewed in Geneva, Oslo, and Gothenburg.
Each round of testing produced specific feedback. I documented what changed between each round and why. Nothing moved to the next iteration without a clear reason traced back to a user observation.
Three rounds of testing on the Current View alone before the design was ready to hand to engineering.
Research data to KPI visualization on user interface
Synthesis of user interviews data: themes across vessel performance KPIs.
Low-fidelity wireframe iteration 1
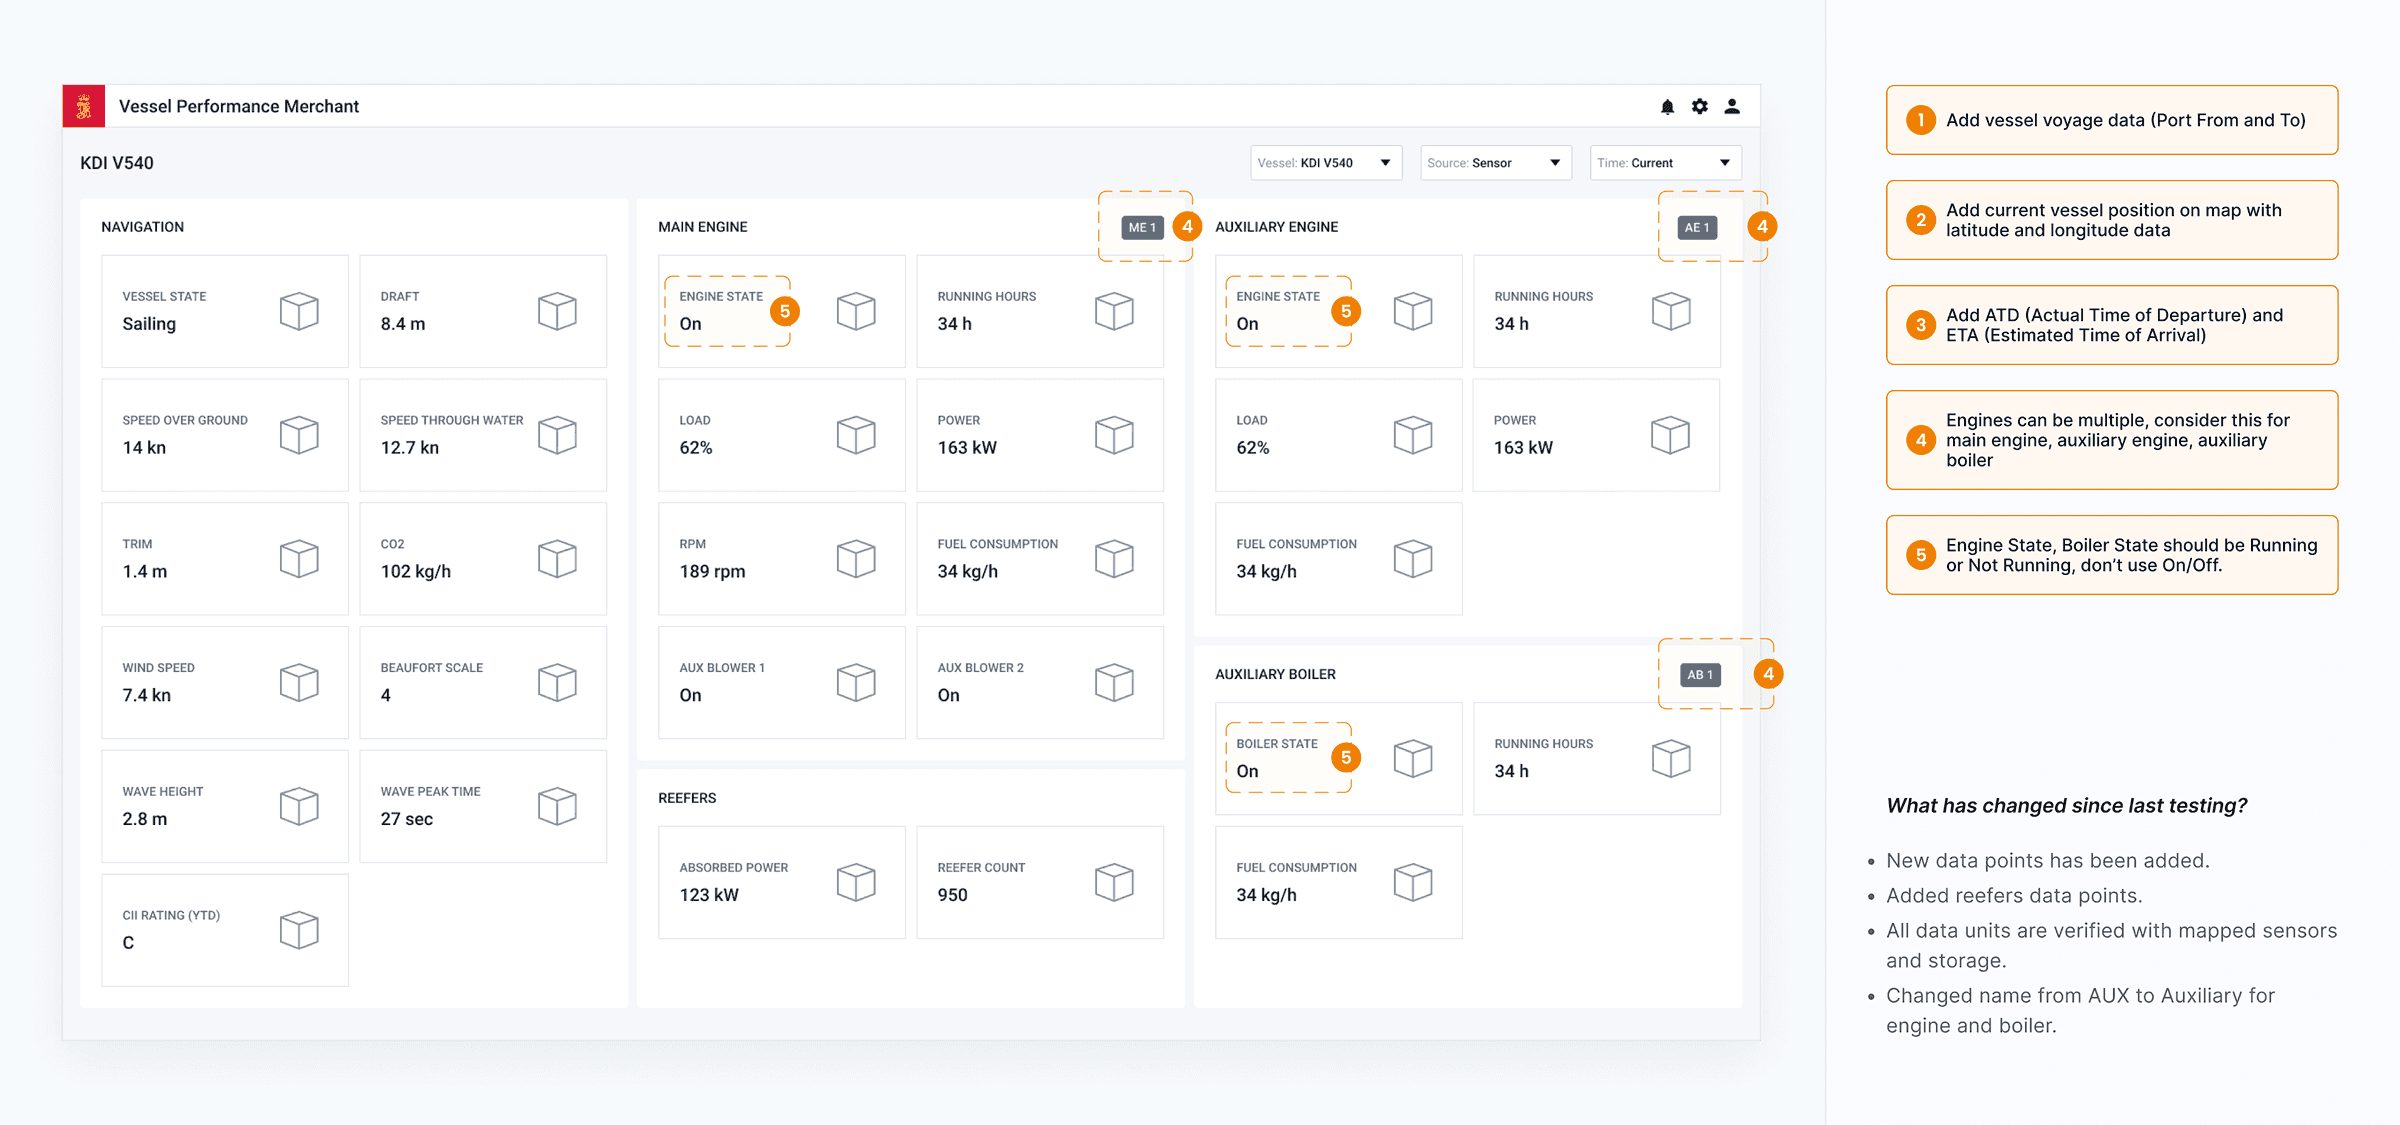
Wireframe iteration 1 user testing results - Vessel Sensor Data Current dashboard
Low-fidelity wireframe iteration 2

Wireframe iteration 2 user testing results - Vessel Sensor Data Current dashboard
Low-fidelity wireframe iteration 3

Wireframe iteration 3 user testing results - Vessel Sensor Data Current dashboard
High-fidelity UI of Vessel Sensor Data Current dashboard

Vessel Performance Merchant - Main Dashboard - Vessel Sensor Data Current.
Constraints and Design Decisions
Constraints and Decisions
Every design decision in Vessel Performance Merchant was made inside real constraints. Data quality issues coming from vessel sensors. Strict maritime compliance report formats. A three month MVP deadline. The need to show all information on one screen without pagination. And no existing icon library that worked for maritime data.
Each constraint had a direct design response.
Constraint
Data quality was inconsistent. Sensor data arriving from vessels had gaps, frozen values, and anomalies.
Design Decision
I annotated data quality directly on the user interface. Fleet performance managers could see exactly where data was reliable and where it was not.
Constraint
Compliance reports had to follow strict maritime authority formats; MRV and DCS.
Design Decision
I worked with Kongsberg Digital's DNV SME's and designed exportable file format of MRV and DCS reports. DNV is the international maritime classification and certification body.
Constraint
The MVP had to be ready in three months with a pilot launch in January 2024.
Design Decision
I designed the Vessel Sensor Data Current View first and shipped it to engineering immediately. Each feature design was completed and handed over ahead of the development sprint.
Constraint
All information had to be visible on one screen. Fleet performance managers could not scroll through pages to find data.
Design Decision
I chose data density over simplicity. Every relevant data point on one screen. No hiding information behind extra clicks.
Constraint
The existing icon library had no maritime icons. Generic icons were too small and unrecognisable for vessel data.
Design Decision
I designed custom maritime icons for the application.
Custom maritime icons

Custom maritime icons for Vessel Performance Merchant KPI dashboard.
Launch and Outcome
Product announcement — November 2023
Kongsberg Digital publicly introduced Vessel Performance Merchant in November 2023. Read more on: Vessel Performance Information
Pilot launch and usability testing — January 2024
Vessel Performance Merchant went live with real users in January 2024. The same fleet performance managers I had interviewed in Geneva, Oslo, and Gothenburg were among the first to use the product and participate in usability testing.
Successful completion three months of usability testing with real users followed before full scale release.
Full scale launch — April 2024
Vessel Performance Merchant launched at full scale in April 2024. The product is listed on the official Kongsberg Maritime product page.
Outcome
650+ vessels onboarded and subscribed. Vessel Performance Merchant became one of Kongsberg Digital's highest performing products in the Vessel Insight SaaS product suite.
Monthly MRV and DCS compliance report generation was reduced from 7 days to under 2 days, including verification after receiving the automated email reports.
Today, Vessel Performance Merchant is used by 450+ active users globally including users from world's largest shipping company MSC.
High-fidelity UI — Vessel Sensor Data Historic dashboard
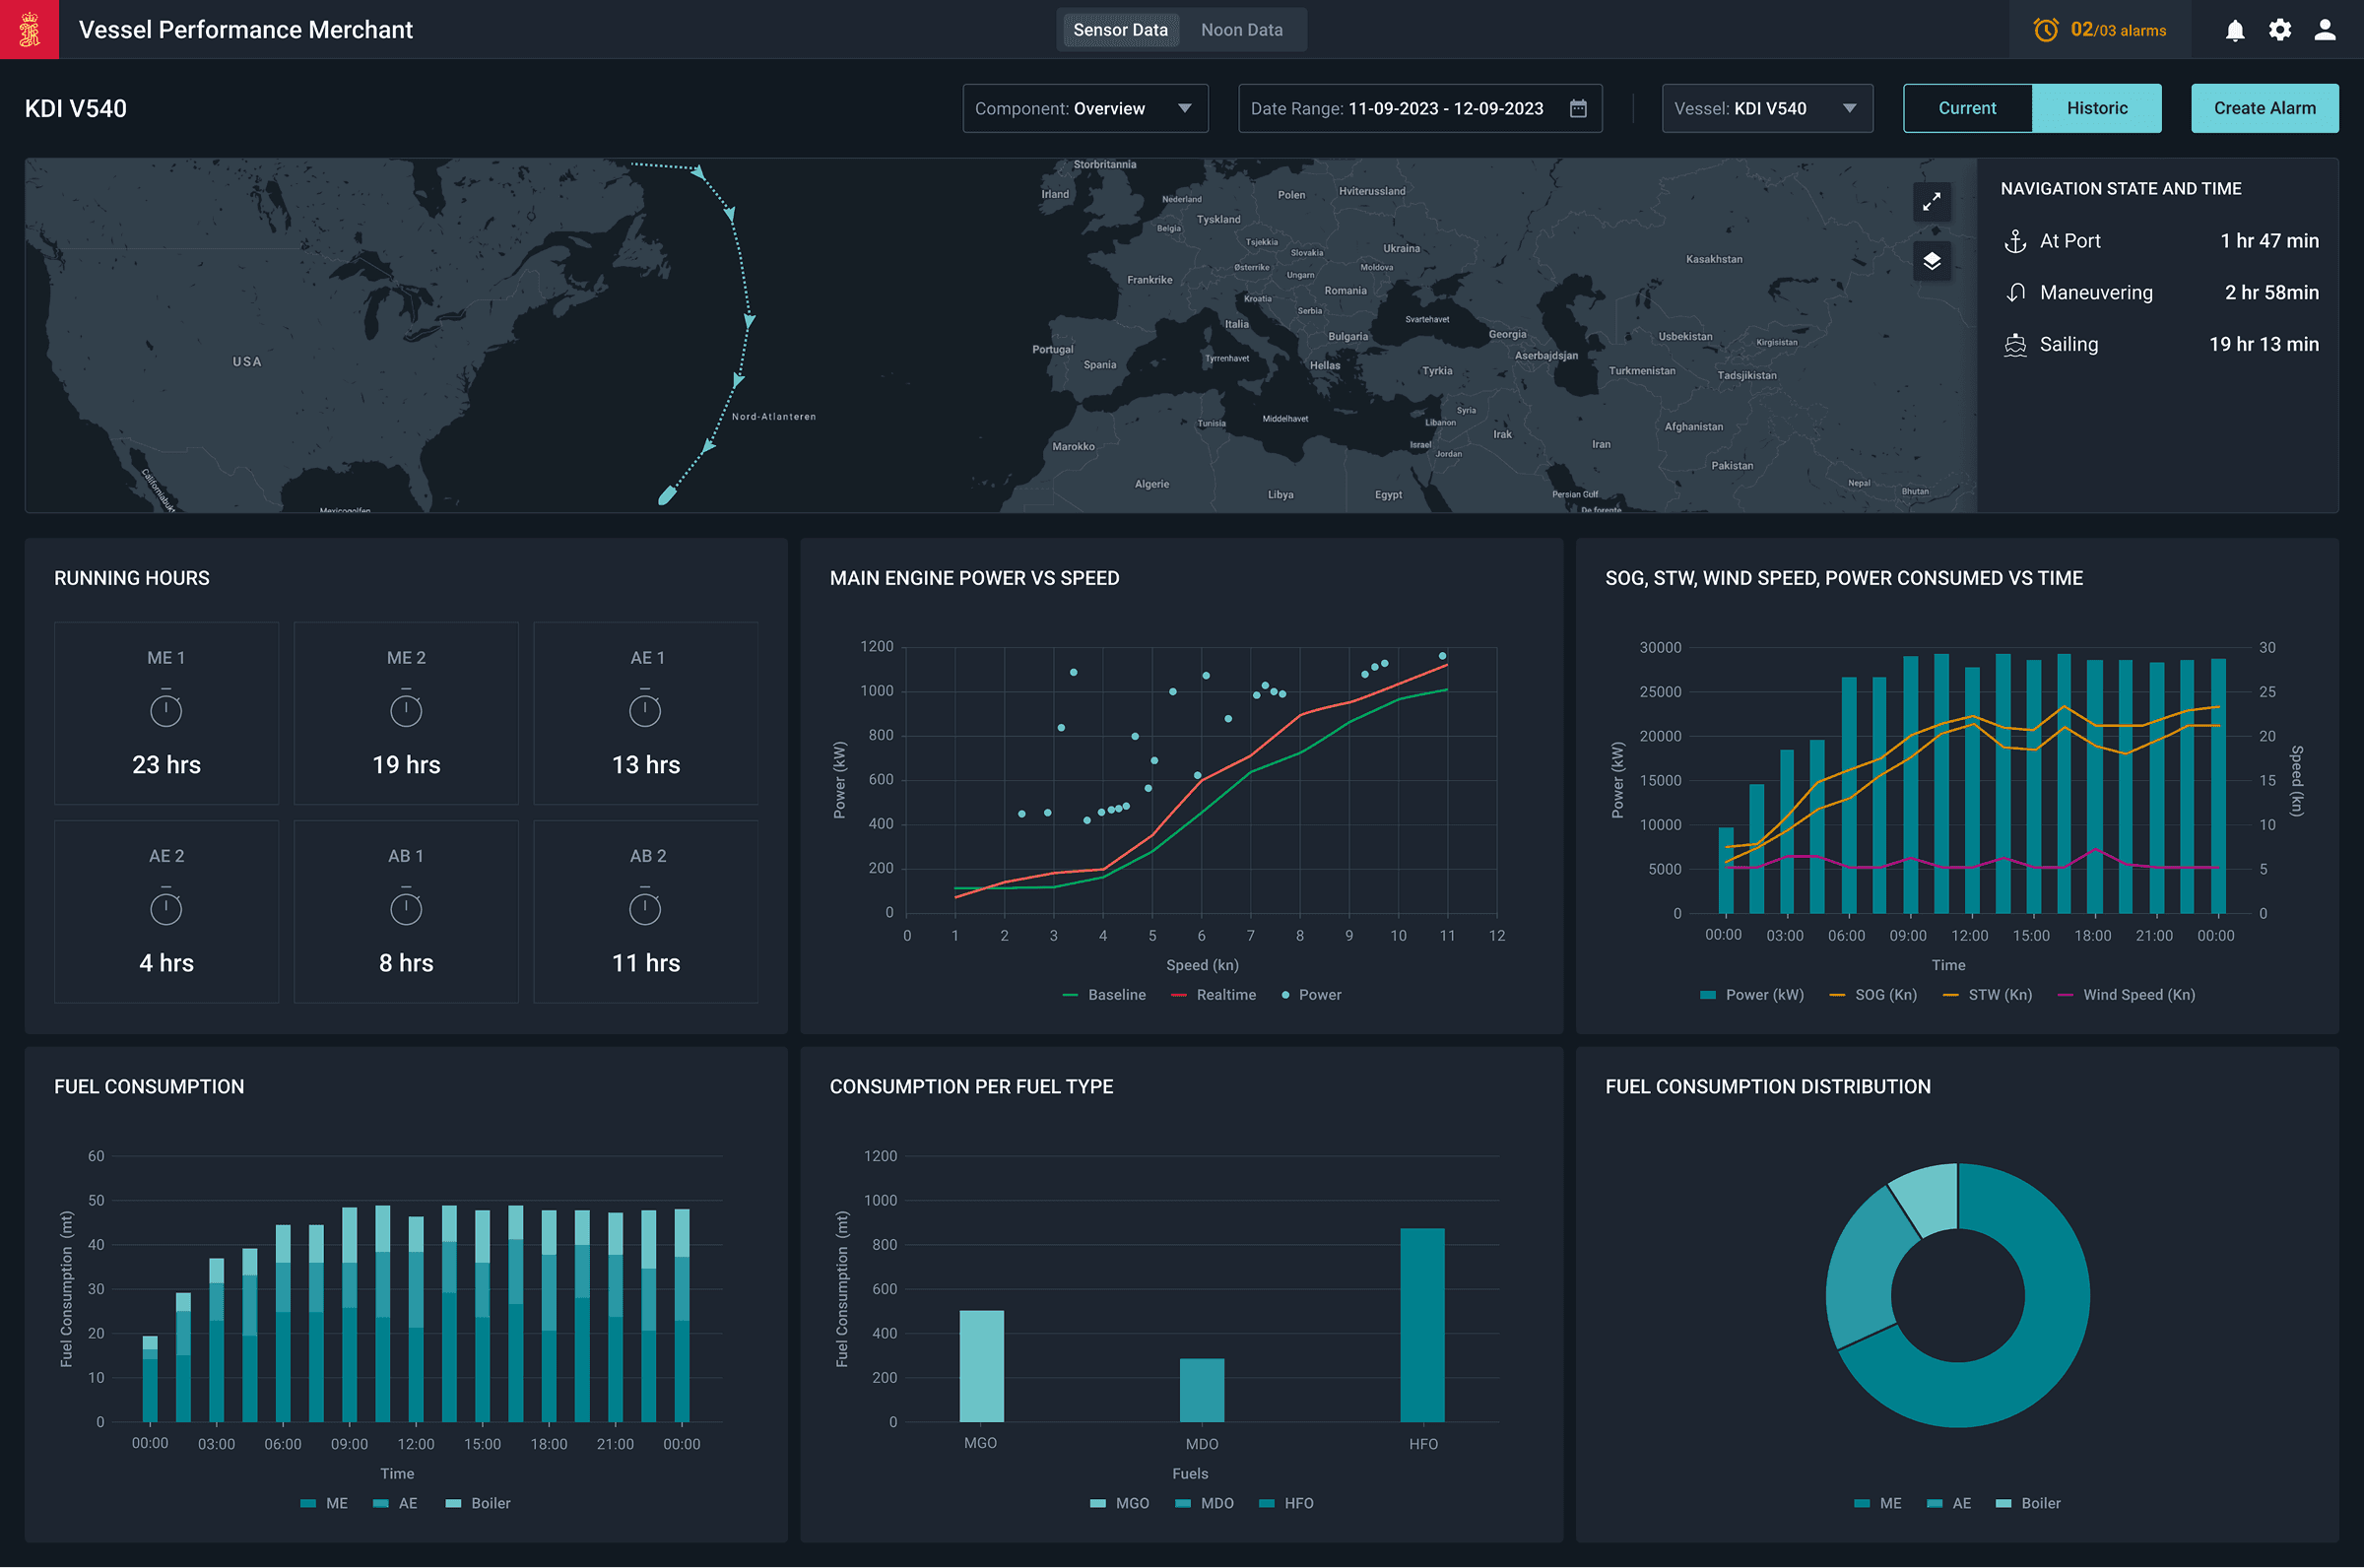
Vessel Performance Merchant - Vessel Sensor Data Historic dashboard